

Every Monday, a sales manager exports the pipeline report to Excel, adds a column to sort deals into "small", "medium" and "large", calculates how many days each deal has been open, then emails the file to the team. It takes an hour, and the numbers are out of date by Tuesday. Most of that work can be done inside Salesforce itself. These Salesforce report tips cover five features of the Lightning report builder that replace the usual spreadsheet steps: bucket columns, row-level formulas, summary formulas, cross filters and subscriptions with conditions. Each one takes a few minutes to set up and needs no code.
Why Salesforce report tips matter more than new dashboards
When reports are hard to read, teams build more of them, or leave Salesforce for Excel. The result is the same: several versions of the truth and a CRM nobody trusts. The features below help you keep one report per question and let the people who use it read it without exporting anything.
A quick check before you start:
- Permissions: creating or editing formulas needs the Report Builder permission (Lightning Experience) or Enhanced Folder Sharing Report Builder for public reports. Subscribing needs the Subscribe to Reports permission.
- Editions: bucket fields and cross filters are listed by Salesforce for Enterprise, Performance, Unlimited and Developer editions. Check yours before promising a feature to a manager.
- Lightning only: row-level formulas are not available in Salesforce Classic, so reports that use them cannot be run or edited there.
Tip 1: Group values with bucket columns instead of new fields
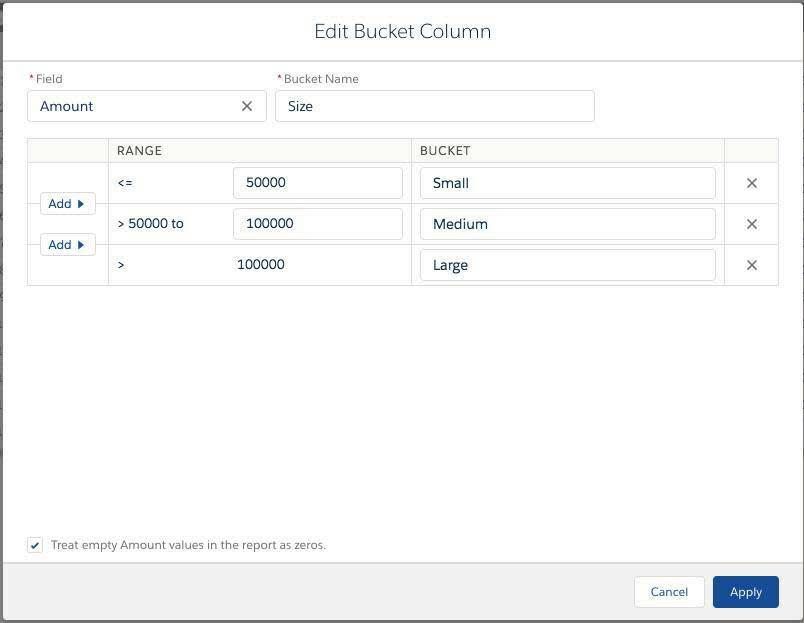
Managers often ask for a new picklist such as "Deal size" or "Region group". If it is only needed for reporting, a bucket column does the job without touching the data model. The Trailhead project Group and Categorize Your Data shows the steps on an opportunity report:
- Open the report in the report builder.
- In the Outline pane, click the arrow next to Columns and choose Add Bucket Column.
- Select the field to bucket, for example Amount, and give the bucket a name such as "Size".
- Define the ranges: Small up to 50,000, Medium up to 100,000, Large above.
- Keep Treat empty Amount values in the report as zeros selected if blank amounts should count as zero.
- Click Apply, then group rows or columns by the new bucket.
Know the limits before you design a report around buckets. According to the Salesforce article on bucket field limitations, a report can hold up to five bucket fields, each with up to 20 buckets and up to 20 values per bucket. With many text values, the query can become too complex well before those numbers. If the same grouping appears in five reports, it probably deserves a real field.
Tip 2: Calculate per record with a row-level formula
A row-level formula adds a calculated column to every row of the report, without creating a custom formula field on the object. Typical uses are "days since created", "amount without VAT" or a simple flag for deals above a threshold. The Help page Write a Row-Level Formula gives the procedure:
- In the Columns section of the Outline pane, click the more actions icon and select Add Row-Level Formula.
- Enter a Column Name and choose a Formula Output Type.
- Write the formula, for example the difference between today and the created date.
- Click Validate, fix any errors, then Apply and Save & Run.
The constraints matter. Salesforce's page of row-level formula tips and limits states that each report supports two row-level formulas, and each formula can reference up to five unique fields. They cannot be used in cross filters or buckets, joined reports do not support them, and they always use the org's default currency, even when the report displays another one. If you need the value in list views, automation or several reports, create a formula field on the object instead.
Tip 3: Compare groups with summary formulas
Where a row-level formula works on each record, a summary formula works on groups and totals: win rate by owner, share of pipeline per lead source, or growth from one month to the next. The Help page Add a Summary Formula Column to a Report notes one prerequisite: the report needs at least one grouping.
- Group the rows, for example by Opportunity Owner.
- In the Columns section, click the more actions icon and select Add Summary Formula Column.
- Name the formula, choose the output type (Percent for a share), and write it using summary values such as the sum of Amount.
- Click Check Syntax, then use FORMAT to set decimals and where the formula appears.
- Click Apply, then Save.
Two functions are worth learning. According to the Help overview of report formulas, PARENTGROUPVAL() compares a group with its parent group or the report total, which gives you "share of total" in one column. PREVGROUPVAL() compares a group with the previous one, which is the basis for month-over-month trends.
Tip 4: Find what is missing with a cross filter
Some of the most useful questions are about absence: accounts without an open opportunity, accounts without any activity this quarter, contacts never attached to a deal. Standard filters cannot answer them; cross filters can. The Help example Use WITHOUT in Cross Filters describes the steps:
- Create or edit a report based on the Accounts report type.
- In the Filters pane, click the more actions icon and choose Add Cross Filter.
- Set Show Me to Accounts, the operator to without, and the secondary object, for example Contacts or Opportunities.
- Click Apply and save.
Salesforce also documents how to build a report of accounts with no activities the same way. The reports and dashboards limits allow up to three cross filters per report and up to five subfilters per cross filter, so "accounts without opportunities closed this year" is possible with a subfilter on Close Date. A cross filter on contacts is also a quick way to spot orphan records before a clean-up, alongside the methods in our guide to Salesforce duplicate rules.
Tip 5: Send reports only when a condition is met
The weekly email from the introduction can be automated, and made smarter. With a subscription, Salesforce runs the report on a schedule and emails it. With conditions, it emails it only when something needs attention. The Help page Subscribe to Reports in Lightning Experience lists the steps:
- On the report, click the more actions icon and select Subscribe.
- Set the schedule and, if needed, attach the results as a formatted report or the report details.
- Click Edit Recipients and add users, groups or roles that have access to the report.
- Choose Run Report As: Me, or another person. Recipients see the data that person can see, which may be more or less than their own access.
- Add up to five conditions, each with an aggregate, an operator and a value, for example Record Count greater than 0. The email goes out only when all conditions are met.
- Click Save.

In practice, a manager subscribes to "Open deals with no activity for 14 days" with the condition Record Count greater than 0, and receives nothing on good weeks. Keep the limits in mind: users can subscribe to up to 15 reports in Unlimited Edition and seven in other editions, and attachments are capped at 15,000 rows, 30 columns and 3 MB. The Run Report As choice is an access decision, so review it with the same care as the permission set groups you assign.
What to do now: rebuild one spreadsheet this week
- Pick one recurring export that a manager rebuilds every week or month.
- List each manual step: grouping, calculation, comparison, filter, email.
- Map each step to a feature: grouping to a bucket column, per-record calculation to a row-level formula, share or trend to a summary formula, "without" questions to a cross filter, the email to a subscription.
- Build the report in a private folder, test it with the manager, then move it to a shared folder.
- Add a subscription with a condition, and stop the manual export.
Before and after, in short:
- Before: an export every Monday, formulas copied by hand, a file emailed to the team and out of date the next day.
- After: one live report in Salesforce, calculated columns that update by themselves, and an email that arrives only when there is something to act on.
Clean reports also depend on clean input. If reps leave key fields blank, the ideas in our Salesforce validation rules tips and our guide to Salesforce Dynamic Forms help you collect the data the report needs.
Conclusion
These five Salesforce report tips replace most of the spreadsheet work that happens around a CRM: buckets for grouping, row-level formulas for per-record maths, summary formulas for shares and trends, cross filters for what is missing, and conditional subscriptions for alerts. Start with one report a manager uses every week, and measure how much time it saves. If your org has hundreds of reports nobody trusts and you want a structured clean-up of reports, dashboards and the data behind them, our Salesforce Sales Cloud consultants and our Salesforce Service Cloud team can review them with your managers.